City map illustrated AI Images

Design illustrated city maps in your browser with Morphic's AI image generator. Generate an axonometric downtown of little buildings, a river waterfront with park greens, or a labeled district overview with landmark pictographs. Drop the finished map into the Canvas to add district labels and a legend.

Illustrated city map elements you can design

Illustrated city map layouts you can compose

District overview

A charming axonometric city of little buildings, labeled districts in soft colour families, park greens and a river in map blue, landmark pictographs marking key spots and a decorative border framing the whole.

Prompt bearbeiten
District overview

Waterfront map

An illustrated riverfront of little buildings along a map-blue bend, a bridge and small boats, park greens on the banks and space kept clear for place labels.

Prompt bearbeiten
Waterfront map

Downtown detail

A close axonometric of the downtown core, dense little buildings and tidy streets, oversized landmark pictographs and a legend corner reserved at one edge.

Prompt bearbeiten
Downtown detail

Legend strip

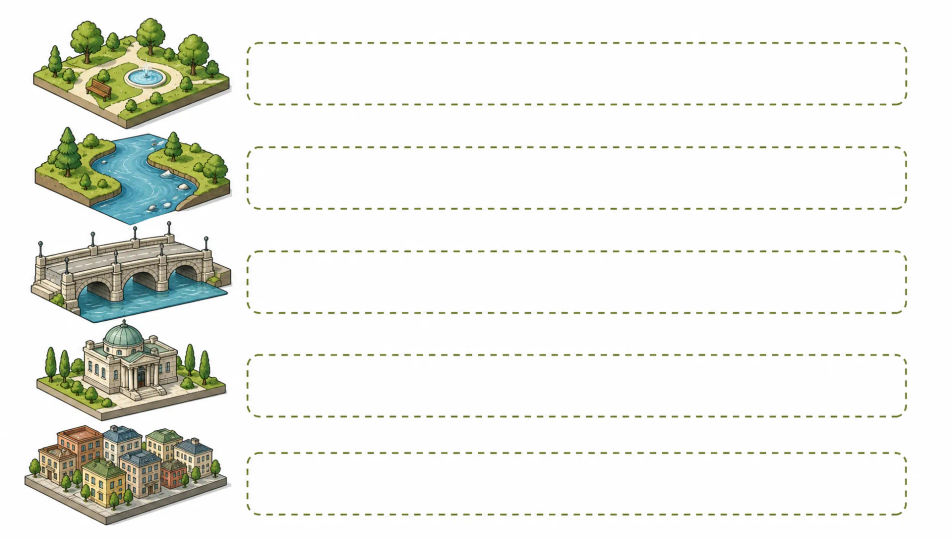
A tidy strip of illustrated map symbols, park, river, bridge, landmark and district, each drawn in the charming axonometric style with label space beside it.

Prompt bearbeiten
Legend strip

City map illustrated in drei Schritten erstellen

  1. 01

    Beschreiben Sie Ihr City map illustrated

    Beschreiben Sie das City map illustrated, das Sie möchten, in einfachen Worten.

  2. 02

    Bild generieren

    Morphic generiert in Sekunden ein sauberes, veröffentlichungsfertiges Bild auf Ihrer Canvas.

  3. 03

    City map illustrated verfeinern

    Passen Sie den Prompt an, generieren Sie Varianten und laden Sie das Bild herunter oder teilen Sie es.

Verwandte Workflows

Das könnte Ihnen auch gefallen

Einfache Preise

Starten Sie noch heute kostenlos, mit der Option, jederzeit zu upgraden oder zu kündigen.

Basic

$0/ Monat
abgerechnet als $0 pro Jahr

900 monatliche Credits

1 Nutzer

Alle Modelle

Workflows

Standard

$0/ Monat
abgerechnet als $0 pro Jahr

3200 monatliche Credits

1 Nutzer

Alle Modelle

Workflows

Pro

$0/ Monat
abgerechnet als $0 pro Jahr

6200 gemeinsame monatliche Credits

1 Nutzer

+ bis zu 4 weitere gegen Aufpreis

Alle Modelle

Workflows

Pro Max

$0/ Monat
abgerechnet als $0 pro Jahr

24000 gemeinsame monatliche Credits

1 Nutzer

+ bis zu 9 weitere gegen Aufpreis

Alle Modelle

Workflows

Enterprise

Für höhere Limits

Individuell

Preis- und Abrechnungsbedingungen

Unbegrenzte Credits
Individuelle Platzlimits
Alle Modelle
Workflows
Pricing Gradient

Free

Zum Ausprobieren

$0

dauerhaft kostenlos

Bis zu 20 Credits
Nur 1 Nutzer
Eingeschränkte Modelle
Workflows

Häufig gestellte Fragen

What defines the illustrated city map look?
An illustrated city map is defined by three signature traits: axonometric little buildings at a friendly tilt, soft colour families for parks, water and districts, and charming landmark pictographs. Keep the buildings tidy and the palette warm and the image reads as a hand-drawn city map.
Where can I make illustrated city maps with AI?
You can create illustrated city maps with AI on Morphic, right in your browser. Open the Image tool, describe the axonometric buildings, the districts, the park greens and the landmarks you want, and Morphic generates the map. No installs and no map software are needed.
How do I get the axonometric little buildings?
Name the register directly in your prompt: "axonometric little buildings, warm rooftops, tidy streets, park greens, map-blue river, landmark pictographs." Calling out the axonometric tilt and the soft colour families is what gives the map its charming illustrated character.
How do I keep a set of illustrated city maps consistent?
Use Morphic's Style Transfer workflow to lock the building style and the colour family from your first map, then reference that style card across the set. Each district carries a different layout while the whole city keeps one look and one legend.
Can I add district labels or a legend to a city map on Morphic?
Yes. Generate the map with banner space and a legend corner reserved, then open the Canvas to place district names and a legend. Keeping the labels as a layer lets you rename districts without regenerating the artwork.
Do I need illustration skill to make illustrated city maps?
No. Morphic runs in your browser and takes plain-language prompts, so anyone who can describe buildings, districts and a river can produce a finished illustrated city map. Cartography or drawing training is not required.