Data Visualization Animation AI Videos

Bring data to life in your browser with Morphic's data visualization animation AI video generator. Generate data visualization animation scenes like a line graph drawing itself across time, a particle field flowing into a shape, or a dashboard of panels lighting up in sequence, and pair them with the Speech and Music tools to voice and score every shot. Stitch the animated data into a full data visualization short on the Canvas.

Data visualization animation elements you can direct

Data visualization animation scenes you can stage

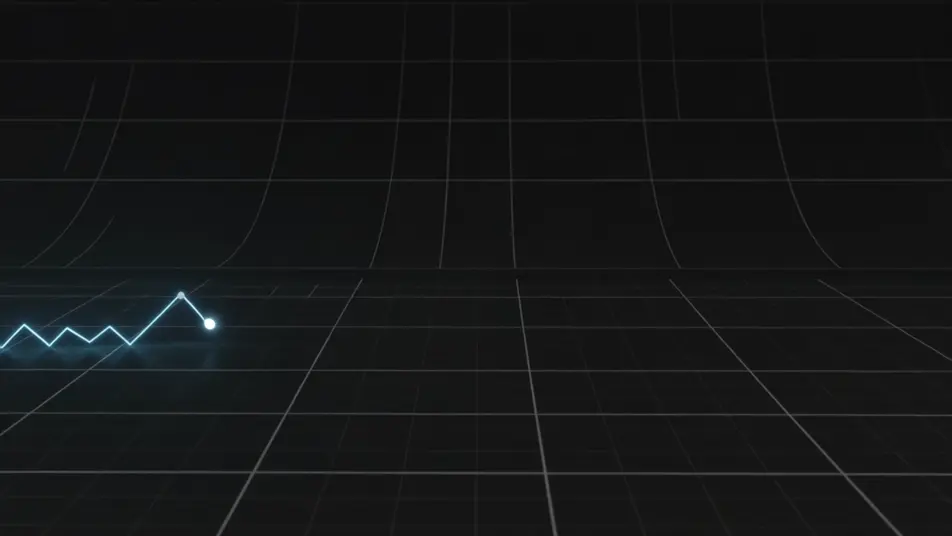
A line graph drawing itself

A glowing line graph tracing a curve across a dark grid, a bright accent stroke, soft plotted nodes, a slow reveal, a gentle push in.

Prompt bearbeiten

A particle field flowing

A dense field of glowing particles drifting in currents and gathering into a shape, cool colour, soft trails, a dark field, a slow drift.

Prompt bearbeiten

A dashboard coming alive

A dark dashboard of panels lighting up in sequence, charts and counters updating, crisp accent colour, thin gridlines, a steady locked frame.

Prompt bearbeiten

A data globe rotating

A wireframe globe rotating with glowing arcs arcing between pulsing nodes, a dark field, cool accent light, a slow steady spin.

Prompt bearbeiten

data visualization animation-Videos in drei Schritten erstellen

  1. 01

    Beschreiben Sie Ihre data visualization animation-Szene

    Beschreiben Sie die data visualization animation-Szene, die Sie möchten, in einfachen Worten.

  2. 02

    Video generieren

    Morphic generiert in Sekunden einen filmreifen Clip auf Ihrer Canvas.

  3. 03

    data visualization animation-Video verfeinern

    Passen Sie den Prompt an, generieren Sie Varianten und laden Sie die Aufnahme herunter oder teilen Sie sie.

Verwandte Workflows

Das könnte Ihnen auch gefallen

Einfache Preise

Starten Sie noch heute kostenlos, mit der Option, jederzeit zu upgraden oder zu kündigen.

Basic

$0/ Monat
abgerechnet als $0 pro Jahr

900 monatliche Credits

1 Nutzer

Alle Modelle

Workflows

Standard

$0/ Monat
abgerechnet als $0 pro Jahr

3200 monatliche Credits

1 Nutzer

Alle Modelle

Workflows

Pro

$0/ Monat
abgerechnet als $0 pro Jahr

6200 gemeinsame monatliche Credits

1 Nutzer

+ bis zu 4 weitere gegen Aufpreis

Alle Modelle

Workflows

Pro Max

$0/ Monat
abgerechnet als $0 pro Jahr

24000 gemeinsame monatliche Credits

1 Nutzer

+ bis zu 9 weitere gegen Aufpreis

Alle Modelle

Workflows

Enterprise

Für höhere Limits

Individuell

Preis- und Abrechnungsbedingungen

Unbegrenzte Credits
Individuelle Platzlimits
Alle Modelle
Workflows
Pricing Gradient

Free

Zum Ausprobieren

$0

dauerhaft kostenlos

Bis zu 20 Credits
Nur 1 Nutzer
Eingeschränkte Modelle
Workflows

Häufig gestellte Fragen

Where can I make data visualization animation videos with AI?
You can create data visualization animation scenes directly in your browser on Morphic. Open the Text to Video tool, describe the visual, the palette, and the motion, and Morphic renders the clip. No data-viz coding needed.
What defines data visualization animation for an AI prompt?
Animated graphs, flowing data, particle fields, or live dashboards, usually glowing accent data on a dark field, with a controlled reveal. Name the visual and how it moves for the look to land.
What kinds of data visualization animation scenes work best with AI video?
Data-led moments: a line graph drawing itself, a particle field flowing, a dashboard coming alive, a data globe rotating. Anchor each scene to one visual and one clear motion.
How do I get the flowing-data look for data visualization animation videos?
Ask for glowing accent strokes on a dark field, soft motion trails, thin gridlines, and a controlled reveal. The glow, the dark backdrop, and smooth flow are what read as animated data.
How do I keep a style consistent across data visualization animation scenes?
Lock the palette, accent colour, and dark-field treatment in your first prompt and reference the same description in every following shot so the visuals read as one system across a connected sequence.
Can I add narration and music to my data visualization animation videos?
Yes. The Speech tool generates a voice-over to walk through the numbers, and the Music tool produces a score. Layer both onto the animated data to publish a complete data visualization short.