What is a product size chart graphic?
A product size chart graphic is a visual that maps measurements to sizes so shoppers can pick the right fit before they buy. For apparel, footwear, furniture, or accessories it is the image that turns a wall of numbers into something a buyer can read in seconds, and it directly cuts the returns and questions that come from sizing confusion.
With Morphic you design this graphic from a text prompt in your browser. Describe the layout, the labels, and your brand colors, then adjust and download in HD. You get a clean, legible chart that matches your store without opening design software.
Define what the chart needs to show
Decide which measurements matter for your product, chest and length for a tee, width and depth for a bag, diagonal and height for furniture. List the size labels and the values before you generate so the graphic has a clear job to do.
Describe the layout you want
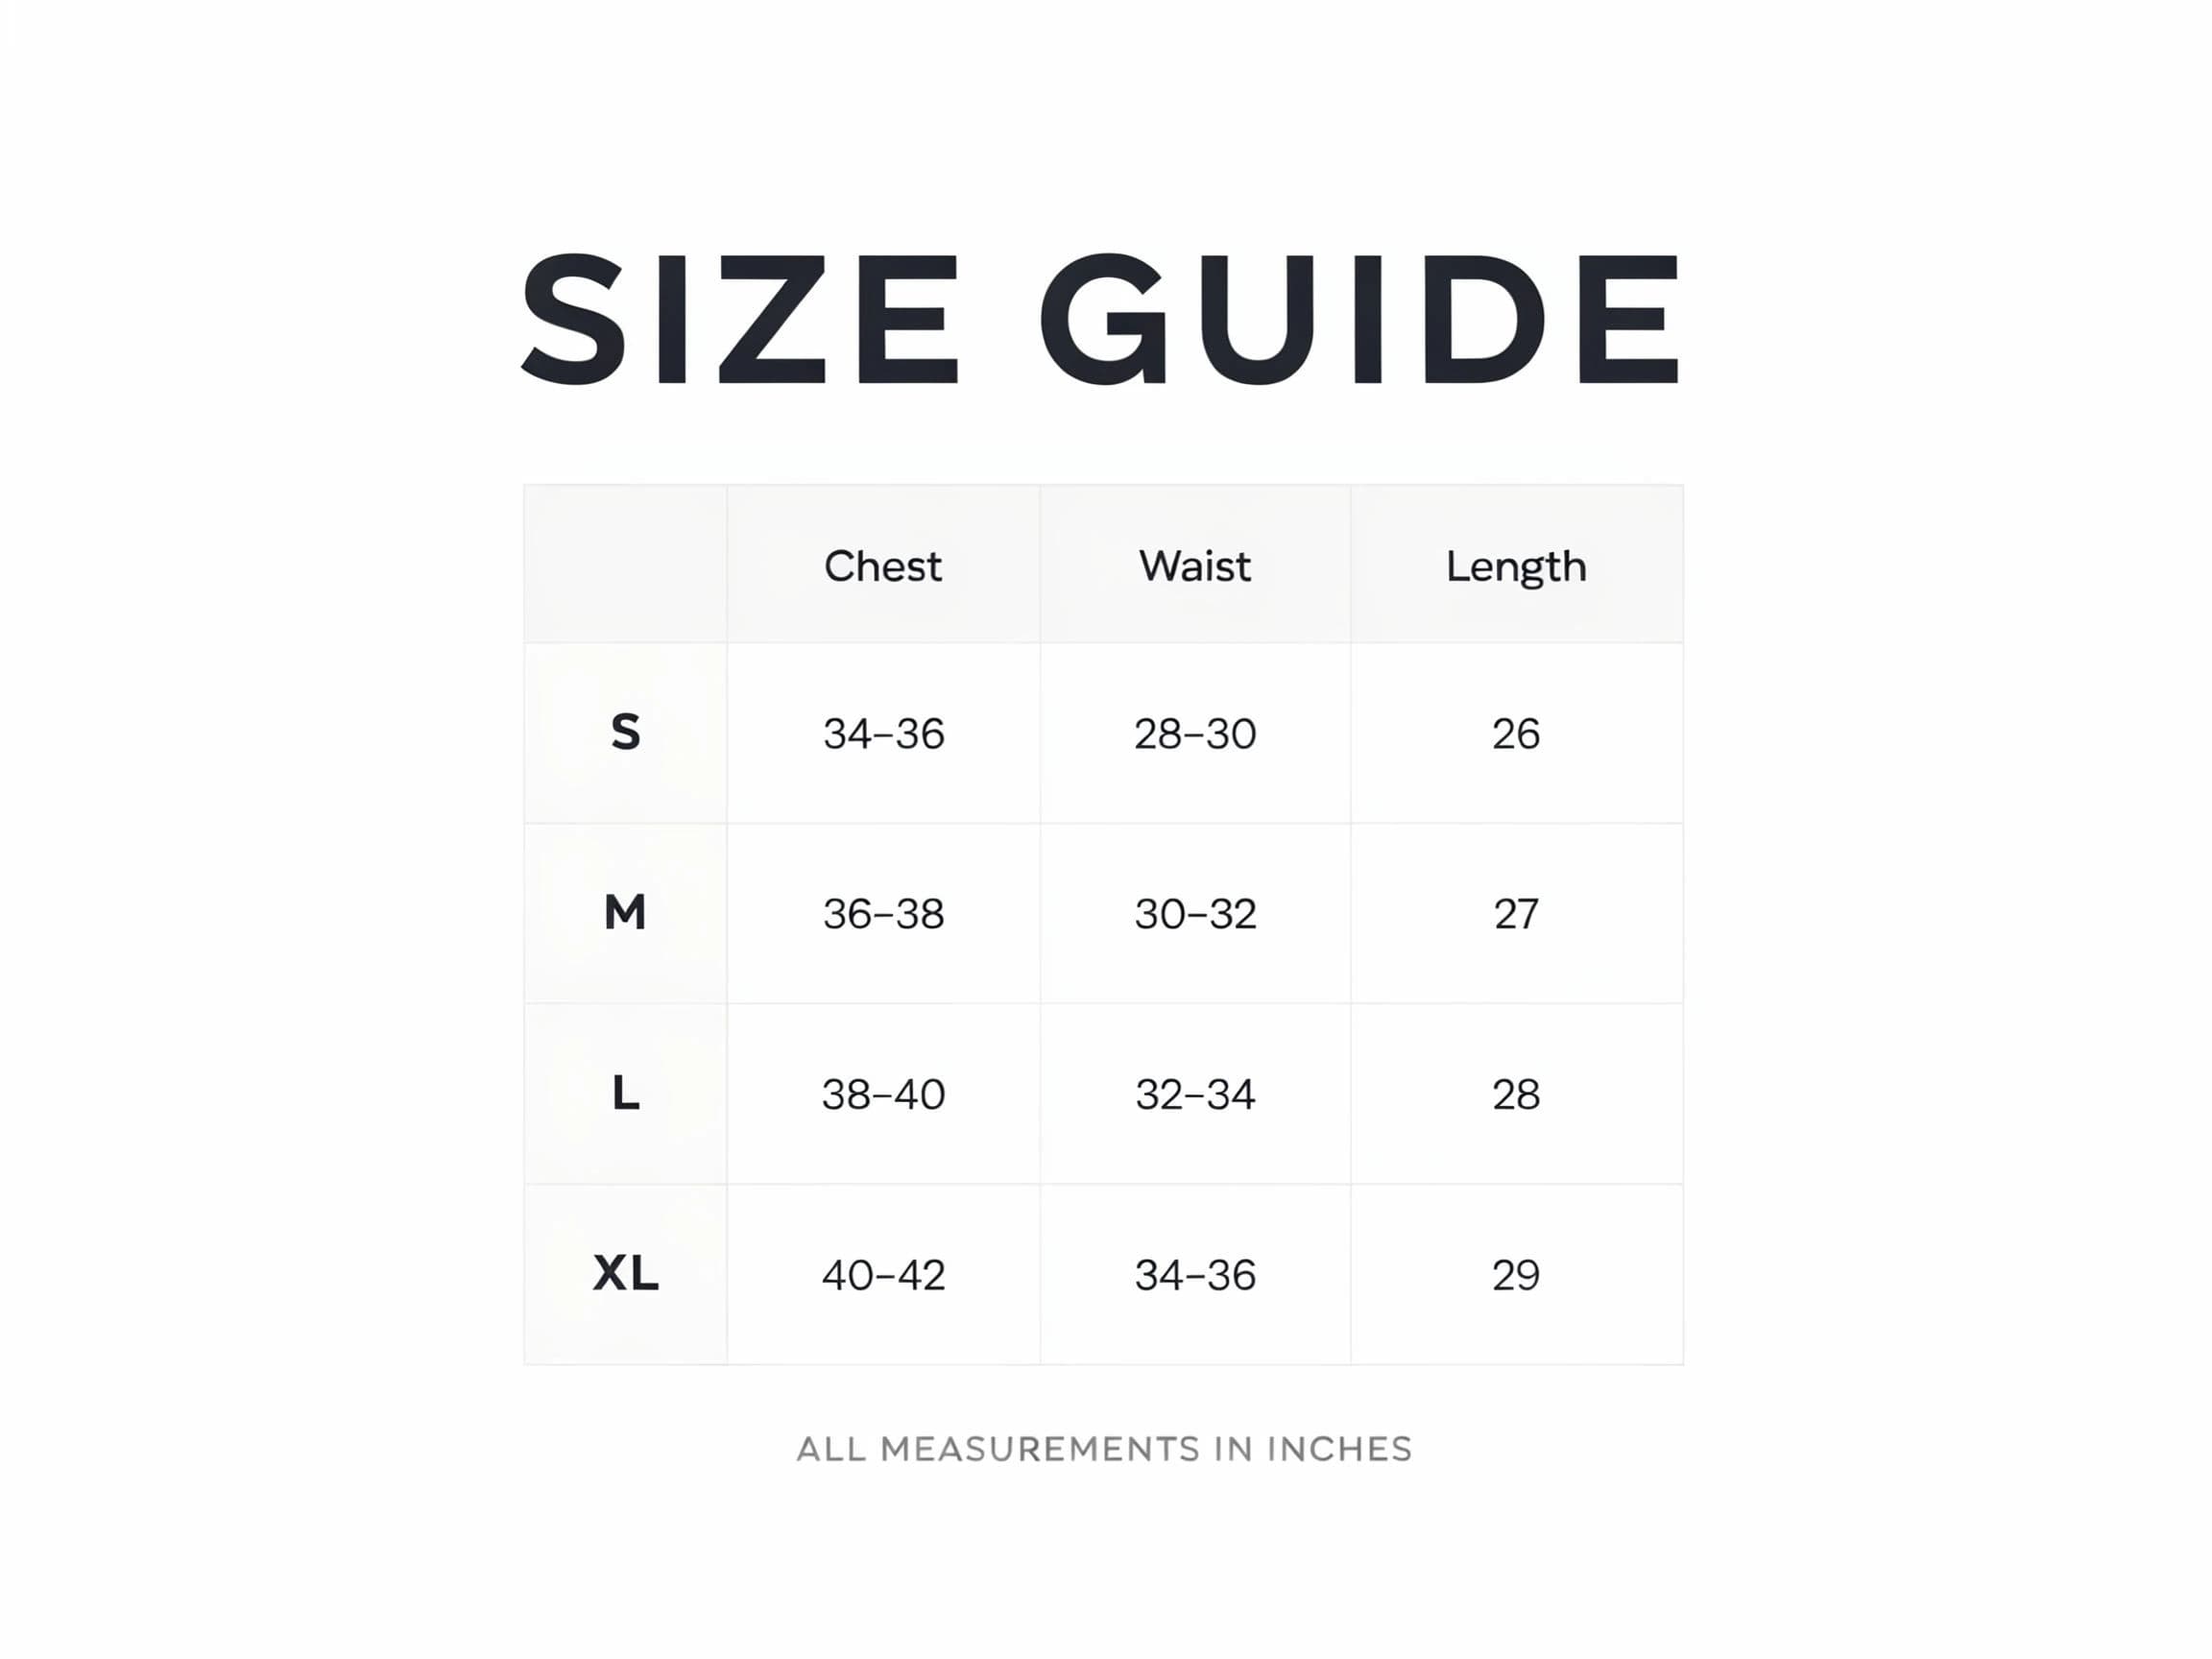
Open Morphic and describe a clean size chart: a labeled grid or a diagram with measurement lines on the product silhouette. Specify column headers, row labels, and whether you want a comparison figure for scale. Generate a couple of layouts and pick the clearest.
Apply your brand look
Ask for your brand colors, a matching accent for headers, and a font style that reads clearly at small sizes. Keep contrast high so the numbers stay legible on both desktop and mobile.
Add a fit or how-to-measure visual
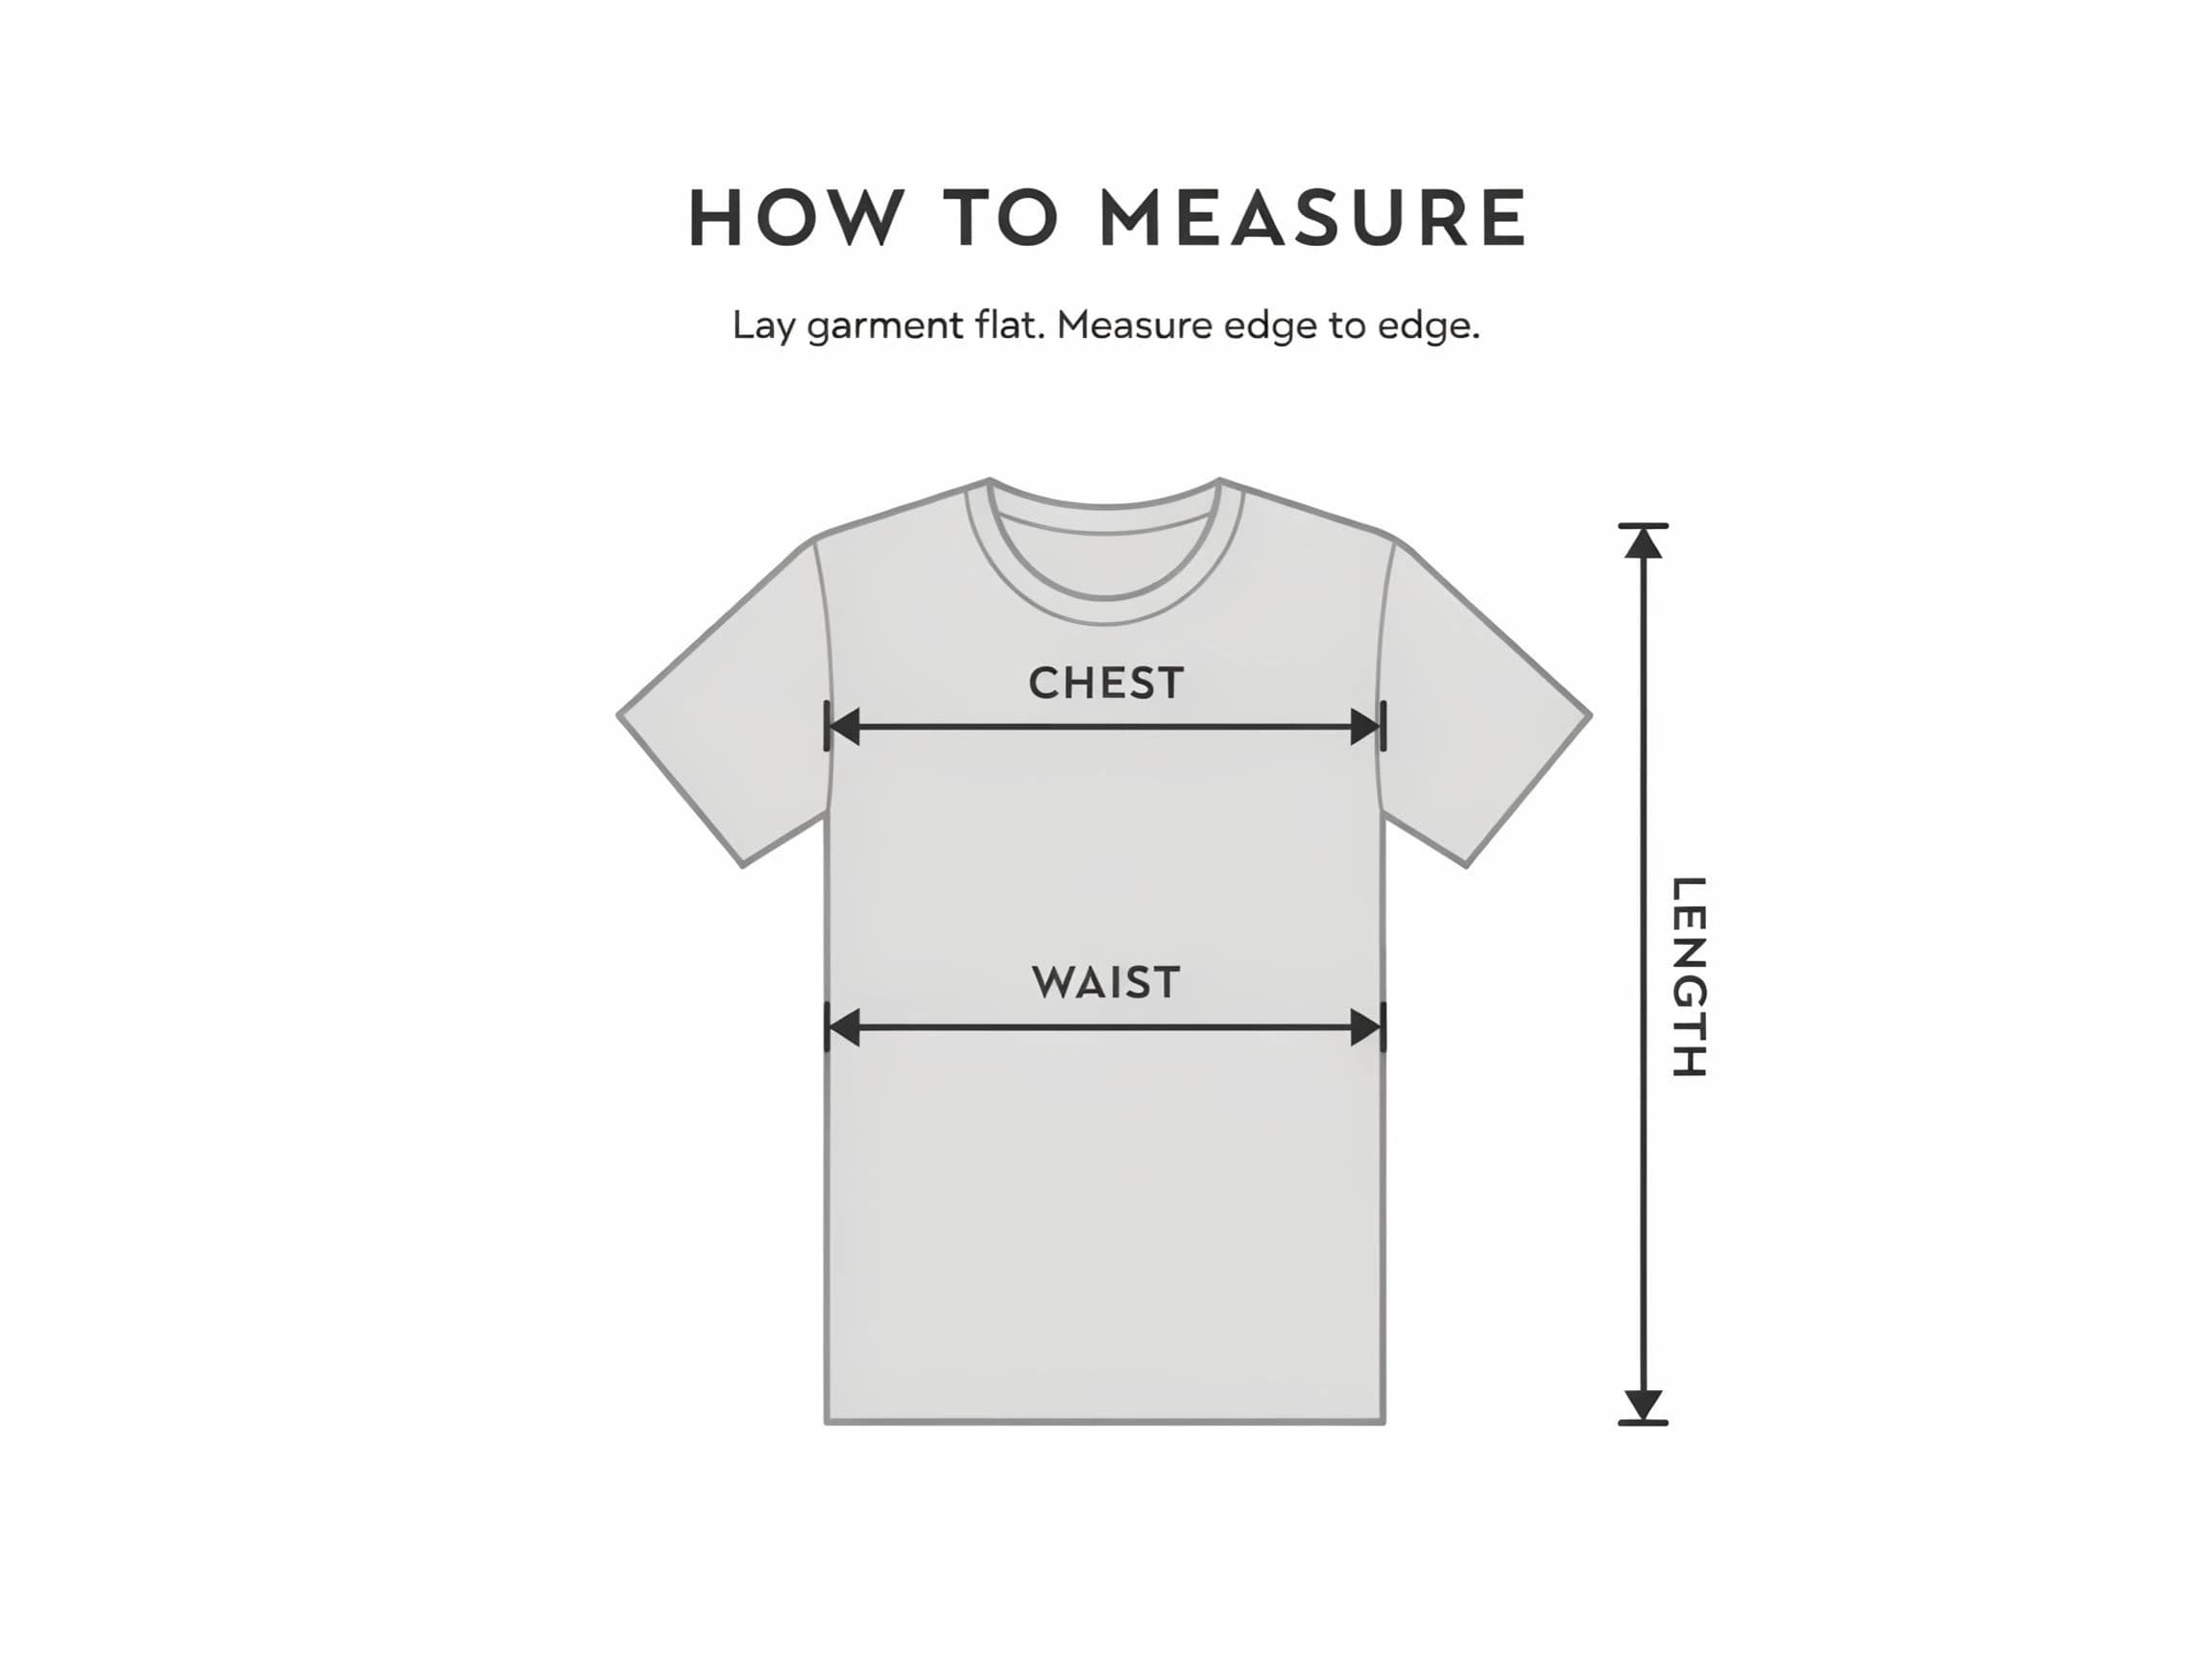
A short how-to-measure diagram beside the chart removes guesswork. Prompt for a simple figure with arrows showing where to place the tape, so buyers trust their own measurements.
Check legibility and export
Preview the graphic at the size it will appear on the listing and confirm every number is readable. Download in HD, then add it to your product gallery or size guide.
Two size-chart layouts: a labeled measurement grid and a how-to-measure diagram.
What makes a great size chart graphic
| Quality | What it means | Why it matters |
|---|---|---|
| Legible at small sizes | Numbers stay sharp on mobile | Buyers actually read it instead of guessing |
| Clear labels | Every row and column is unambiguous | No misreading that leads to a wrong size |
| How-to-measure aid | Diagram shows where to measure | Buyers trust their own numbers |
| On-brand styling | Colors and type match the store | The chart looks like part of the page |
Morphic vs the traditional design route
| Morphic | Design software or a designer | |
|---|---|---|
| Cost | Available on Morphic | Software subscription or design fee |
| Time | A finished chart in minutes | Hours of layout and revision |
| Skill needed | Describe the layout in words | Vector and typography skills |
| Updates | Regenerate with new values | Manual edits for every change |
FAQs
Yes. Describe your brand colors, header accent, and font style, and generate the chart to match. Keep contrast high so it stays legible everywhere.
Yes, if you prioritize legibility. Preview the graphic at listing size, keep high contrast, and regenerate if any value looks cramped before you publish.
Yes. Prompt for a simple figure with arrows showing where to place the tape. That visual helps buyers measure correctly and trust the chart.
Any product with sizing, apparel, footwear, bags, furniture, or accessories. Describe the relevant measurements and the graphic adapts to your category.
Describe the new values and regenerate. There is no manual redraw, so keeping the chart current is quick.
Yes. Graphics you generate with Morphic are cleared for commercial use across your listings and marketing.